Optimaliseren van frameworksjablonen voor het uitleggen van testresultaten

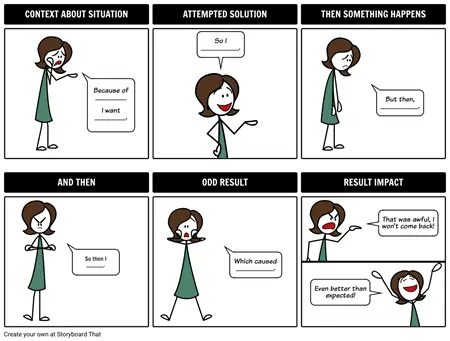
Klanten interacteren vaak op verrassend creatieve manieren met producten en diensten in plaats van je zorgvuldig ontworpen plan te volgen. Verschillende analytische tests kunnen onverwachte resultaten opleveren die niet met cijfers te verklaren zijn. Door het proces visueel weer te geven van wat je denkt dat er gebeurt, kun je een hypothese met anderen delen en licht werpen op wat er tijdens een test is gebeurd. Deze inzichten kunnen leiden tot nieuwe producten of fundamentele veranderingen in je bedrijfsmodel. Het boek Lean Startup van Eric Ries gaat hier uitgebreid op in.
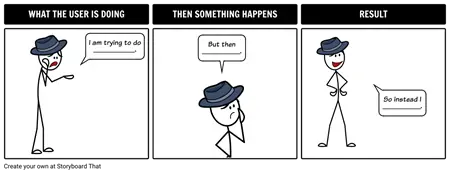
Het raamwerk hiervoor is: Dit – Dan Dat – Resultaat.
- Dit: Wat is de gebruiker gaan doen?
- En toen: Wat deden ze toen?
- Resultaat: Gevolg van gebruikersacties.
Storyboard-voorbeelden

Hoe u onverwachte resultaten kunt uitleggen met behulp van frameworksjablonen
Engage students with interactive storyboard activities that explain test results
Transform test result explanations into interactive learning by having students create their own storyboards. This method helps students visualize the process, understand cause and effect, and develop critical thinking skills.
Introduce the 'This – Then That – Result' framework using real-life classroom examples
Start by sharing relatable scenarios (like a science experiment or math problem) and break them down using the framework. Students will see how actions lead to results, making abstract concepts more concrete.
Guide students to brainstorm and sketch their own storyboards
Encourage students to choose a classroom test or project and outline each step with drawings or digital storyboards. This hands-on approach boosts engagement and supports visual learners.
Facilitate peer sharing and discussion of storyboard explanations
Organize students into pairs or small groups to present their storyboards. Peer feedback sparks new ideas and reinforces understanding through collaboration.
Reflect on how visual storytelling clarifies test outcomes
Wrap up by asking students to share what they learned from visualizing test results. Reflection deepens comprehension and encourages metacognitive skills.
Veelgestelde vragen over het uitleggen van onverwachte resultaten met frameworksjablonen
What is a framework template for explaining test results?
A framework template for explaining test results is a structured approach that helps educators and teams clearly communicate test outcomes. It typically breaks down findings into steps like This – Then That – Result to make analysis easy to follow and actionable.
How can I use storyboard examples to explain unexpected test results in class?
You can use storyboard examples to visually map out the sequence of student actions, outcomes, and consequences. This makes it easier for students to understand complex or surprising results, fostering discussion and deeper learning.
Why is visualizing test processes helpful for students?
Visualizing test processes helps students see the steps and logic behind results, making abstract concepts more concrete. This approach encourages engagement and critical thinking, especially when results are not what they expected.
What are the benefits of using 'This – Then That – Result' for lesson planning?
Using the This – Then That – Result structure in lesson planning provides clarity, encourages step-by-step thinking, and helps educators pinpoint where learning gaps or misunderstandings may occur.
Can framework templates be adapted for different grade levels or subjects?
Yes, framework templates are flexible and can be customized for any grade level or subject area. Adjust the complexity of each step to suit your students’ needs and subject matter.
© 2026 - Clever Prototypes, LLC - Alle rechten voorbehouden.
StoryboardThat is een handelsmerk van Clever Prototypes , LLC , en geregistreerd bij het US Patent and Trademark Office

